
That’s a question that every manager across all layers of the organisation gets. It’s a simple enough question on the surface, but the answers are usually complicated and riddled with disclaimers.
At some point, you have to wonder: Why do so many organizations assume that every project’s benefits are conveniently canceled out by some vaguely understood, unfortunately timed negative change? The project team claims success, business units avoid adjusting targets—everyone wins, except the organization itself
If pharmaceutical companies can measure the impact of new treatments — despite countless confounding factors — why do so many businesses claim that their environments are ‘too dynamic’ to evaluate change? The reality is, they could if they applied even a fraction of the rigor pharma uses.
Now, most would argue – there’s no way we’re investing in the level of sophistication a biostatistics department runs with. And my argument is that, unless your products are a matter of life or death, you don’t have to. But we can be inspired by the existing scientific process and apply it to our businesses.
Let’s run through a typical example and research question: “Has the new project reduced task processing times”. Below is a high level overview of the sequence of steps required.
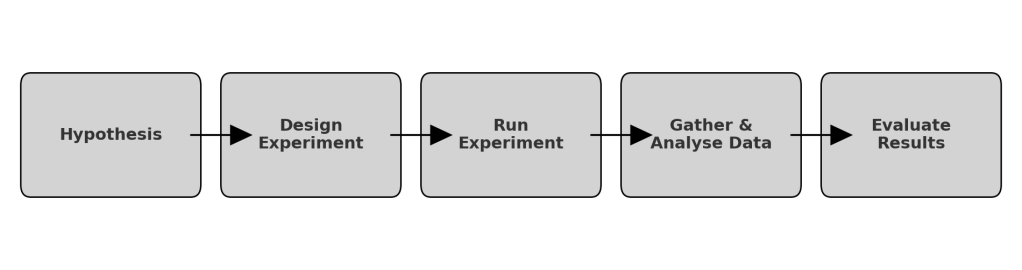
1. Define your Hypothesis
Before you even being the project’s implementation, you need to have defined your hypotheses. This seems trivial, but clearly stating what you’ll be evaluating ensures all of your stakeholders are onboard with what metrics you’re targeting to improve and there’s no ambiguity in the desired effects.
You need two hypotheses – the null and the alternative. The null hypothesis represents business as usual—no change. The alternative hypothesis is what you’re trying to prove: that the project made a difference.
2. Design and Run Experiment
This is the stage in which most organisation will drop the ball. However, the importance of your experimental design cannot be understated. Your decisions will make or break your ability to justify your project’s impact.
First, choose your experiment’s design. Here are the two most common and simple methods:
| Experiment Design | Details |
|---|---|
| Before and After | A simple and cost-effective approach where the same group is measured before and after implementation. However, this method is highly sensitive to external noise (e.g., seasonal trends, market changes), which can distort results. |
| A/B Testing | A more robust approach where two groups—one using the new process and one continuing with the old—are tested simultaneously. This method controls for external factors but requires careful change management, as running two processes in parallel adds complexity. |
Second, choose the statistical test you’ll plan on running. You are not limited to only one test and your choice is not set in stone – that said, it’s important to have a plan of how you’ll evaluate your project.
The specific test to run depends on the attributes of the data you’re collecting. Most of the time you’ll be using t-tests, which assumes normal distribution of your data. Regression analyses are also a common and flexible choice. We won’t dive into the details of these tests here, but note e.g. the t-test is a build-in Excel function and implementing it requires minutes. See below table for a high-level summary.
| Test Name | Data Type |
|---|---|
| Independent t-test | Normal distribution, independent sample, equal variance of groups |
| Paired t-test | Normal distribution, paired sample, different variance of groups |
| Mann-Whitney U test | Non-normal distribution, independent sample, equal variance |
| Wilcoxon Signed-Rank test | Non-normal distribution, paired sample, different variance of groups |
| Linear Regression | Linear relationship, normal distribution of residuals, others, homoscedasticity, independent samples |
Third, consider your significance level. Also known as your p-value. It tells us how likely our results are due to random chance. A common threshold is 5%—if the p-value is below this, we conclude the project had a real effect. That said, don’t be overly rigid—no one will care about a p-value of 5.1% in a typical business environment.
The final thing to consider is what is your optimal sample size. You don’t want to run your experiment for too long and waste resources, but you also don’t want to end your experiment too early and find you need more data. As it’s generally expensive to re-start an experiment, unless really pressed on resources, I would lean towards building in a comfortable buffer. If you’re not sure how much data you need, tools like sample size calculators (or even ChatGPT) can help estimate it. If you want a more rigorous approach, a Monte Carlo simulation can model different scenarios to find the best balance between cost and accuracy – note ChatGPT can do that for you too.
3. Analyze Data & Evaluate Results
When you’ve designed your experiment and collected the data, it’s time to determine whether your project actually made an impact. This final step involves calculating your test statistic, interpreting the results, and generating conclusions that can drive decision-making.
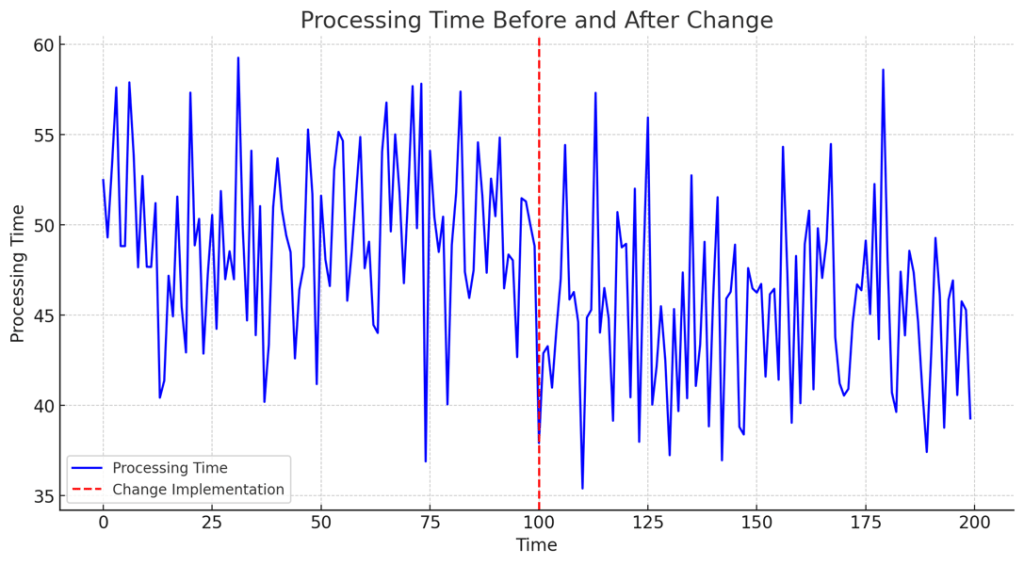
Here’s an example of how your raw data might look like, assuming the “before/after” design was used:
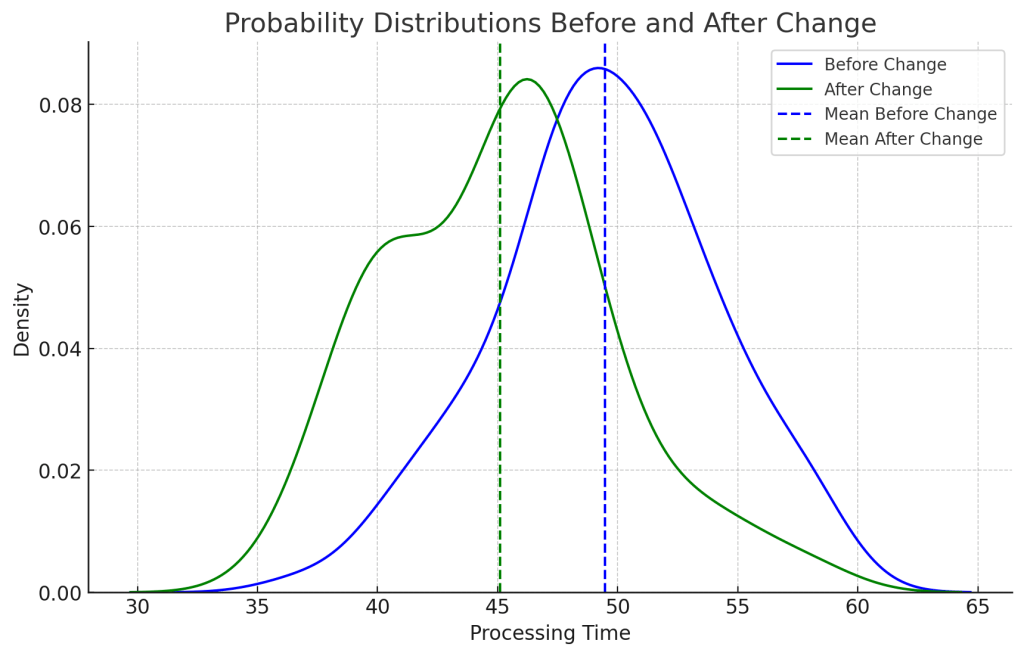
A more powerful overview is to examine the histograms or KDEs of the two groups. The example below already gives us a really strong indication of what our results will be. The mean difference between the two groups is 5 minutes and we can already visually see how the two distributions are distinctly different. Next step is to have our statistical tests confirm that.
Using the chosen test (e.g., t-test), calculate the test statistic and the p-value. Most tools—Excel, Python, R, or even online calculators—can do this in seconds. The test statistic tells you how different your groups are, while the p-value quantifies the likelihood that these differences occurred by random chance.
If p-value < significance level (e.g., 0.05), we reject the null hypothesis. This means the observed change is statistically significant, and you have evidence that the project had an effect
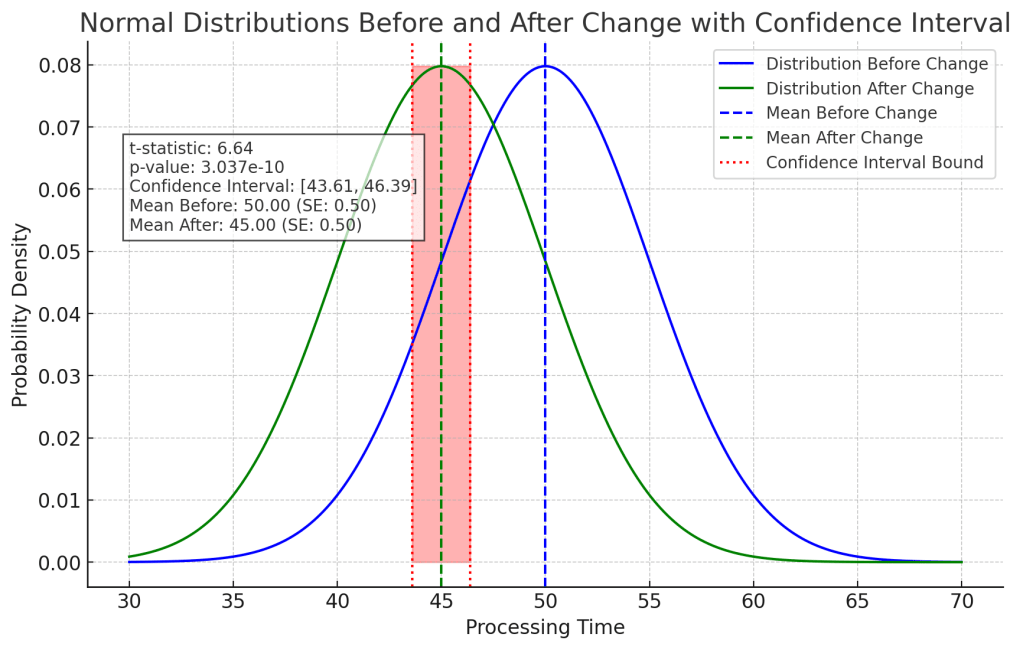
In this case, the t-test confirms what was already visible in the visualization – with a p-value of approx. 0.00, it’s highly unlikely that the difference we see in means is due to random chance. We can comfortable reject the null hypotheses. You now finally have data-driven evidence that the project had a statistically significant impact.
Summary: Measuring With Confidence
Evaluating a project’s impact isn’t just about changing averages —it’s about determining whether that change was meaningful, measurable, and worth the investment. By applying structured hypothesis testing, organizations can move beyond vague assumptions and confidently assess whether an initiative has truly improved performance.
Beyond statistical significance, it’s essential to consider practical implications. While the results confirm an improvement, the next step is determining whether this reduction translates to meaningful operational benefits—such as cost savings, increased throughput, or improved customer experience.
Key Takeaways:
1. Define Success Clearly – Establish hypotheses upfront to ensure stakeholders align on what success looks like.
2. Design Thoughtful Experiments – Whether using before-and-after comparisons or A/B testing, the experimental design must minimize bias and account for variability.
3. Leverage Statistical Rigor – Using appropriate statistical tests, confidence intervals, and standard error calculations ensures conclusions are based on evidence, not assumptions.
By embedding a scientific mindset into business decisions, organizations can manage uncertainty and ensure that projects deliver real, measurable value — not just perceived success. Ultimately, what gets measured gets improved—but only if it’s measured correctly.

Leave a comment